How to Calculate a Soakaway Test Infiltration Rate
Of course, the first thing to say is that if you're using Pebble Geo to enter your soakaway test results, you won't have to worry about this, because the software will perform the calculation for you when you print your logs. However, it's worth knowing how we perform this calculation, and why it's important.
What is an Infiltration Rate?
Very simply, it is the speed at which water filters into the ground, and it is used to work out the effectiveness of a soakaway on a construction site, for example for a drainage scheme.
The test is carried out by rapidly filling a trial pit with water, and then recording the water level as it drops over time. The test is typically repeated three times in the same pit, and the slowest result used for the design calculations.
It is most often measured in m/s and the result is a value measured across a specific depth range within the pit, and is reported in scientific notation.
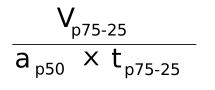
There is a standard formula, outlined in BRE Digest 365, which is used to calculate the infiltration rate:
Where:
V p75-25 is the volume of water stored (outflowing during the test) in the trial pit between 75% and 25% levels of the maximum effective depth (the 'effective storage depth'). If there is a granular fill, this value is multiplied by its porosity, as a ratio. E.g. if a fill is assumed to be 40% porous, the effective volume should be multiplied by 0.4. In Pebble Geo, this is calculated as [(pit width x pit length x effective storage depth) / 2] x porosity.
a p50 is the internal surface area of the trial pit up to 50% effective storage depth, including the area of the base. Effectively mirroring the 25-75% area. So (pit width x pit length) + (pit width x effective storage depth) + (pit length x effective storage depth). For the area of the walls we could divide by 2 for the 50% area on the wall and then times by 2 for the two walls with the same area but these cancel out so are not required.
t p75-25 is the time taken (in minutes) for the water level to fall from 75% to 25% effective storage depth, normally taken from the slowest of the three tests.
Effective Storage Depth
Effective storage depth is one of the key pieces of information required for this calculation. The effective storage depth is the maximum depth of water at the start of the test, measured upwards from the base of the pit. NOTE: The storage depth is NOT simply the total depth of the pit.
In order to give a representative result, the actual infiltration rate is calculated only from the depth/time readings between the 75% and 25% effective depth (i.e. the middle 50% of the total effective storage depth). In the calculation, this typically means interpolating (or reading off) a time value at the exact 75% and 25% depth levels, which Pebble Geo does automatically of course. We can see these levels clearly represented in the diagram below:
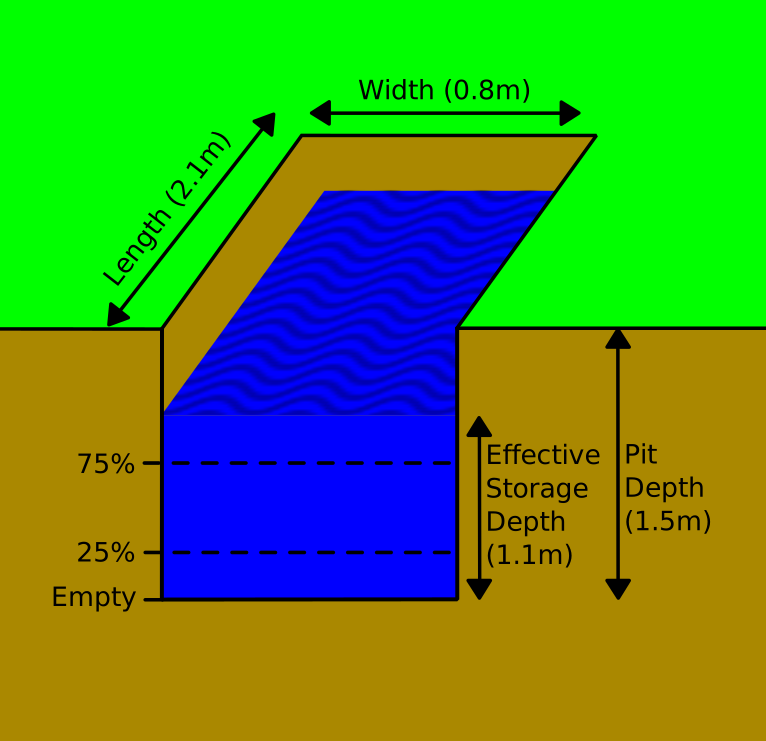
In the above example, the maximum storage depth is 1.1m, and the 50% storage depth that will be used in the infiltration rate calculation is 0.55m (1.1 x 0.5)
Inputing Soakaway Data Using Pebble Geo
The information about the soakaway construction can be stored in the ISAG sheet in the Pebble Geo excel template. You can leave the ISAG_SI column blank as Pebble Geo will calculate the infiltration rate for you.

For the test, the pit is filled rapidly water and then depth-to-water measurements are taken at regular time intervals. Typically, the infiltration rate slows geometrically as the pit empties, and so the measurement intervals get longer over time.
The test is stopped when the water has dropped below the 25% storage depth level, or sometimes when all of the water has left the pit. If the pit drains very slowly the test is sometimes stopped before the water level drops below the 25% effective storage level, and the final time value for the 25% level is extrapolated from the last two data points.
We can enter this data in the ISAT sheet in the Pebble Geo excel template as shown below:
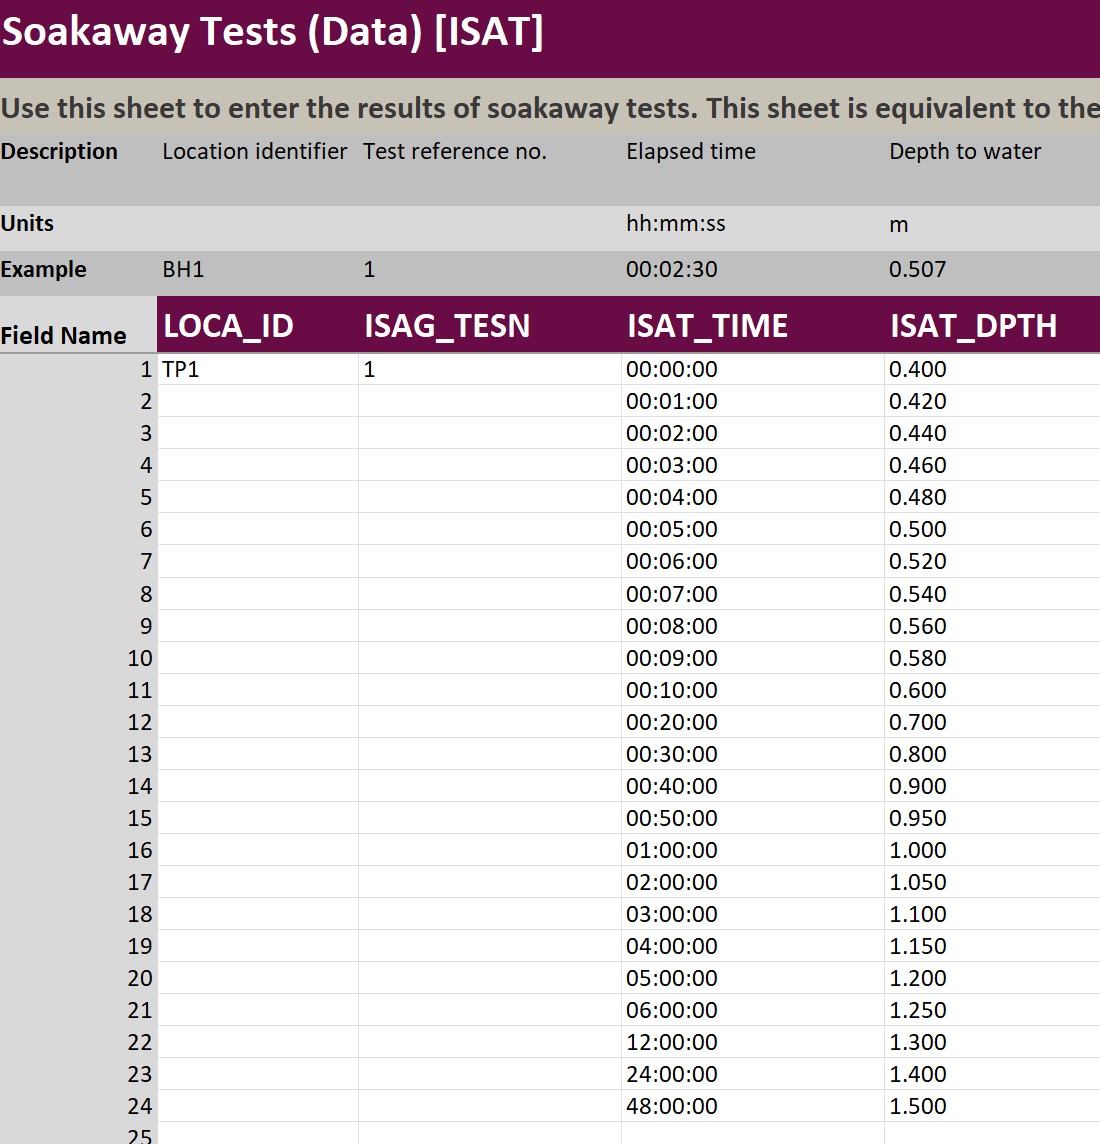
Elapsed time is recorded here in hh:mm:ss format. In Pebble Geo you can instead just enter the number of minutes into this field as a whole number if you prefer.
This data produces a plot like the following Pebble Geo graph:
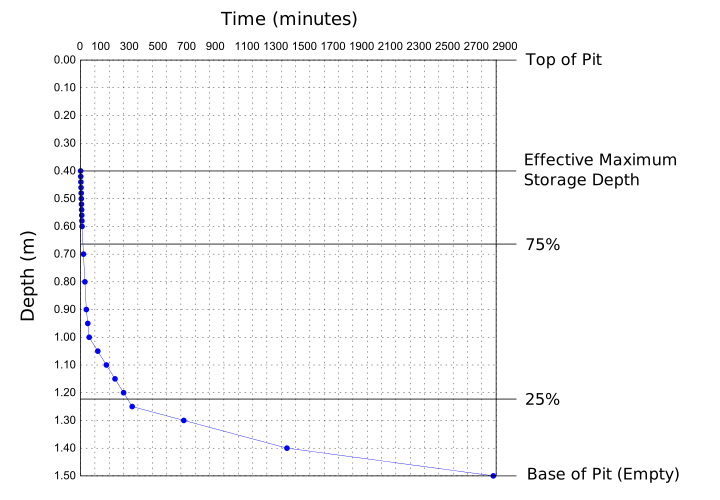
Note that in this example, for simplicity of illustration, the end of the test is recorded when the water reaches the base of the pit (after 48 hours in this case). It is also normal, and perhaps more common in practice, for tests to be terminated before the water reaches the bottom of the pit. This can happen either when the water has dropped below the 25% effective depth level (thereby representing a completed BRE 365 test), or when the water infiltrates extremely slowly, or the level stops dropping altogether due to the water table. In the latter case, the calculation will need to be extrapolated using the last two data points. There is more detail on this in a later section.
Worked Example
The infiltration rate for this data would be calculated in Pebble Geo as follows:
Maximum storage depth = 1.1 (m)
Effective storage depth (75% - 25%) = 1.1 x 0.5 = 0.55 (m)
(the 0.5 in the above expression being 50% of the maximum storage depth, because we're testing only between the 75% and 25% levels)
Vp75-25 = 0.8(w) x 2.1(l) x 0.55(ESD) = 0.924 (m3)
ap50 = 0.8 x 2.1 (base = 1.68) + 1.1 x 2.1 (2 sides = 2.31) + 1.1 x 0.8 (other 2 sides = 0.88) = 4.87 (m2)
tp75-25 = (p25)330min/19800s - (p75)18min/1080s = 18720 (minutes)
f = 0.924 / (4.87 x 18720) = 0.924 / 91166.4 = 1.01e-05
The infiltration rate is therefore worked out to be 1.01e-05 m/s, rounded to 2 decimal places, and in scientific notation units, which is a typical way to report the result.
Here is another worked example on the same data but with a granular fill of 40% porosity. A granular fill is often used where the structure of the pit is at risk of collapse.
Vp75-25 = 0.8(w) x 2.1(l) x 0.55(esd) x 0.4 = 0.3696
f = 0.3696 / (4.87 x 18720) = 0.3696 / 91,166.4 = 4.05e-06 m/s
Common Pitfalls in Soakaway Calculations
Incorrect Maximum Storage Depth CalculationThe maximum effective storage depth should always be calculated from the top of where the water is filled, down to the base of the pit, and not simply to the base of the water at the end of the test.
If the storage depth is calculated based on the vertical distance between the water level at the top of the test and the water level at the bottom of the test then it becomes logically obvious that one could stop the test at an arbitrary point, and thereby end up with an arbitrary or biased infiltration rate.
Pebble Geo will calculate the effective storage depth for you, so you do not have to worry about it.
Extremely Slow Infiltration (Failure to Reach 25% Storage Level)If it is not feasible to wait for the water level to drop below the 25% storage level (because the water drains extremely slowly, or stops draining altogether) then it will be necessary to extrapolate the graph beyond the data (i.e. down to the 25% storage level) in order to read off a time with which to calculate an infiltration rate.
Pebble Geo will perform this calculation automatically, and will provide a warning label on the resulting PDF plot. The way the time to the 25% storage depth level is worked out is to find the point on the line constructed between the last 2 points with different depth values. For example, if in the test above we had finished our recordings at 60 mins, the extrapolated time to cross 25% would have been 100mins instead of the real 330 mins.
However, be aware that these rates will be less accurate.
If you need any help with inputting soakaway data or calculating an infiltration rate using Pebble Geo just get in touch with us.